


 Whatsapp
 Telegram
Gold prices are consolidating at a high level and are awaiting an upward breakthrough.
"Gold Prices Consolidate at High Levels, Await Breakout Higher" – Completed on 16/6/2026 at 11:15
The U.S. and Iran are on the verge of signing an agreement to end nearly four months of conflict, with U.S. Vice President Vance stating that both sides completed electronic signing on Sunday. Notably, while Trump claimed that the Strait of Hormuz, reopening this Friday, will be permanently toll-free, Iran has stated it will impose fees for navigation services, environmental protection, ship insurance, and other necessary service charges. In my view, this clearly appears to be Iran inventing excuses to extort shipping companies! On another front, Trump announced he would allow Iran limited uranium enrichment, restricting its use to non-military purposes.
Regardless, the market has temporarily accepted the end of U.S.-Iran hostilities and the easing of Middle East tensions. The three major U.S. stock indices rose again, with the Dow Jones reaching a new all-time high. However, it should be noted that among the three indices, the Dow lags behind the others. In other words, unless the Nasdaq strongly breaks to new highs, a sharp reversal signal such as a "head-and-shoulders" pattern could trigger a significant correction in the U.S. stock market. The Federal Reserve will release its interest rate decision tomorrow night (Thursday morning), which is expected to maintain rates unchanged. It is also likely that the Fed will express concern over persistently high inflation, which explains yesterday's sharp rise followed by a pullback in gold prices.
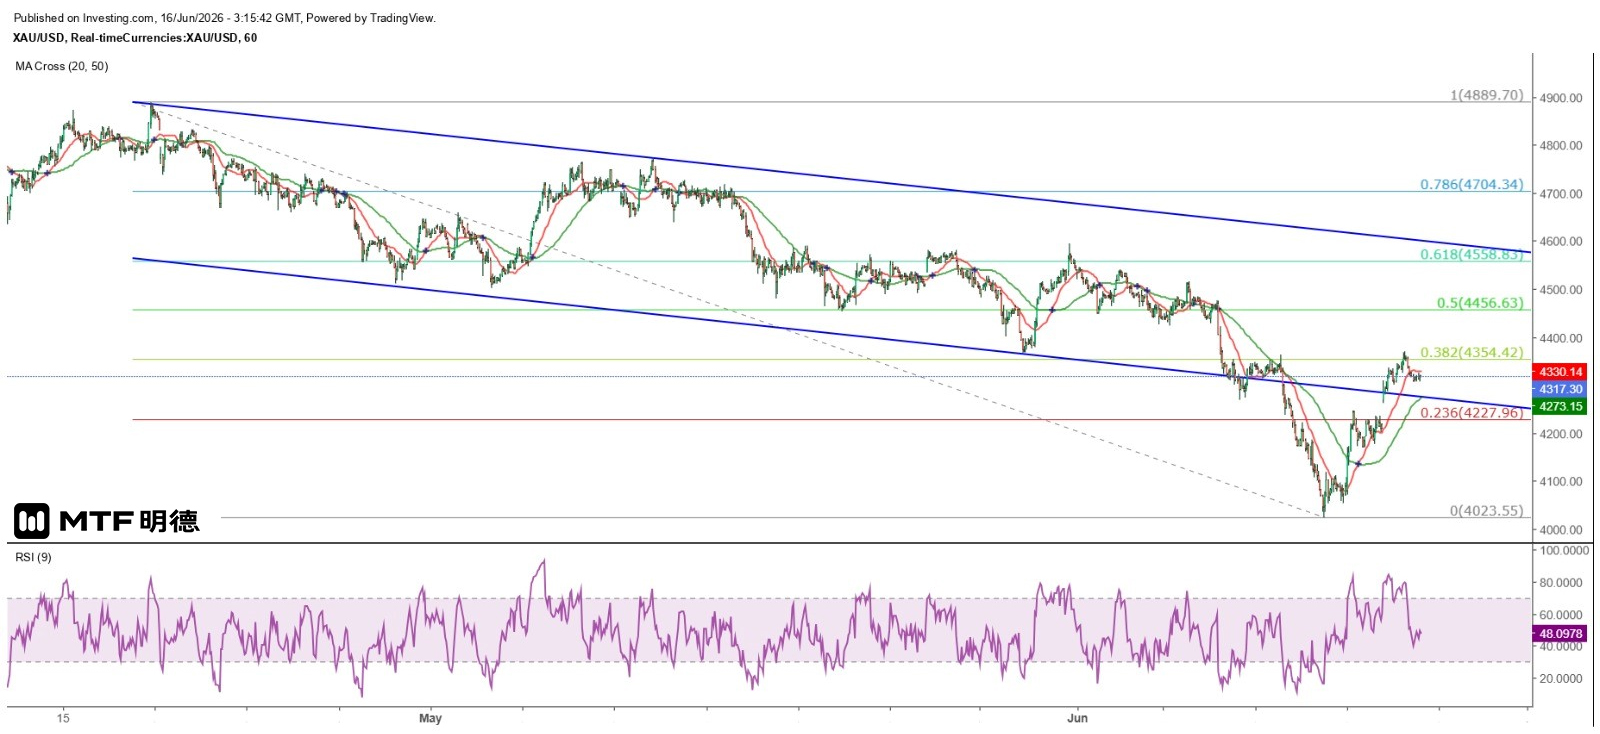
As seen on the hourly chart, after reaching a high of $4,369.19 during early New York trading yesterday, spot gold prices retreated and later broke below the 20-period SMA (currently around $4,330), subsequently consolidating sideways. In today's early Asian session, prices remained narrowly range-bound, fortunately holding above $4,310. Measured from last Thursday’s low of $4,023.96, the cumulative rebound has slightly exceeded the 38.2% retracement of the decline since April 17. From a technical standpoint, resistance at $4,370 appears significant—this level marks the top of the consolidation zone between June 5 and 9, as well as being near the correction low of May 28. Judging by the current trend, gold is likely to break above $4,360, potentially testing $4,410 or even $4,460 before a more substantial pullback emerges. The 50-period SMA (currently around $4,273) and $4,300 are expected to provide strong intraday support.
The above information is for reference only and does not constitute investment advice.
Next Article


